version 1(my first official version!)
A downloadable project

This update is the first major version. It has graphs and the simulation itself.
the graph
The graph updates every ten frames, easy to understand with a time-quantity graph.
the simulation
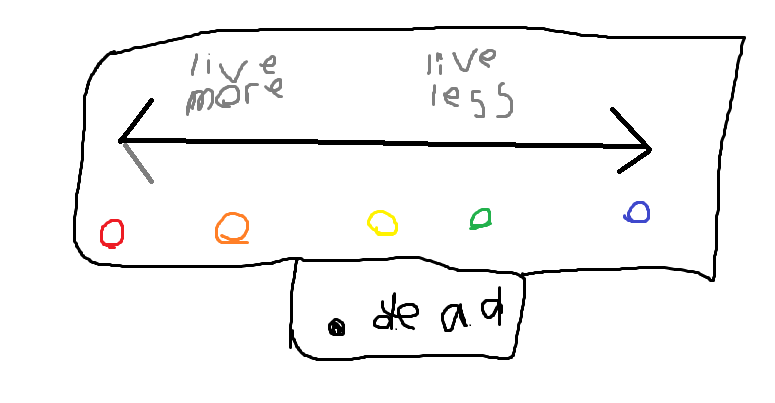
The simulation shows 5 different species.red, orange, yellow, green and blue.
The image above shows that the more red it is, the longer it lives and the more blue it is, the shorter it lives. It can range from 10-50 frames.
Well, you got all the info you need to start analysing simulations!
bye!
| Status | In development |
| Category | Other |
| Author | tysonpina |
| Genre | Simulation |
| Tags | anylysing, Relaxing |
Download
Download
tk.exe 31 MB
